10-Year Treasury Yield vs. 10-Year TIPS Spread: An accurate indicator of inflation?
May 2019
By Ben Wierzba, CCUIP, ALM & Investment Analyst at Corporate Central Credit Union and QuantyPhi
The yield spread between the 10-year Treasury note and the 10-year Treasury-Inflation Protected Security, or 10-year TIPS, has had the reputation of providing indication of what investors see as the future inflation rate. In order to understand why this indicator is reviewed, we first need to understand what each security is.
The 10-year Treasury note is a debt obligation issued by the United States government with a maturity of ten years when first issued. Interest is paid semi-annually based on the face value to the holder at maturity.
Treasury Inflation-Protected Securities, or TIPS, provide protection against inflation. Protection against inflation is provided by the market value of the bond adjusting with the rate of inflation, measured by the Consumer Price Index (CPI).1 Interest is paid semi-annually, and payments rise and fall with the inflation rate, because the interest rate is applied to the adjusted value of the bond. For example, an investor purchases $1,000 in a 10-year TIPS, with a coupon rate of 2%. After six months, inflation was measured at 1%. The semi-annual payment to the investor would be $10.10. The amount is calculated by the following steps:
Adjusted principal - $1,000 * 1% = $10
Total principal - $1,000 + 10 = $1,010
Interest - $1,010 * 2% = $20.20 / 2 = $10.10 semi-annual payment
Spread Analysis
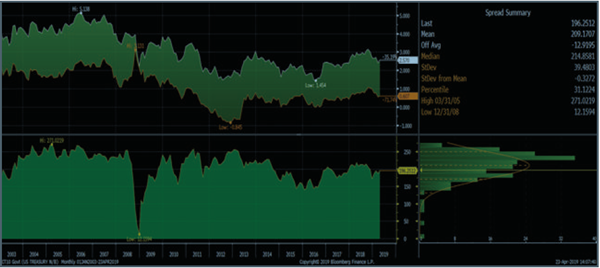
The top chart in the display above compares the 10-year Treasury yield and the 10-year TIPs yield since 2003.
The bottom chart shows the spread between the yield on the two securities. The tightest spread was in
December of 2008, where the 10-year note yield was 12 basis points above the TIPS. Within one year, the
spread widened back to levels where the average spread was 2.08%.2
The spread between the two securities can be referred to as the “breakeven” inflation rate. The difference can
also be described as what investors expect the average inflation rate to be in the next ten years. If the inflation
expectation is accurate, both bonds will provide the same inflation adjusted return over the ten year period.
Without further research, an investor can base their inflation expectations on this spread alone. However, in
doing so, how accurate has this spread measured versus actual CPI data?
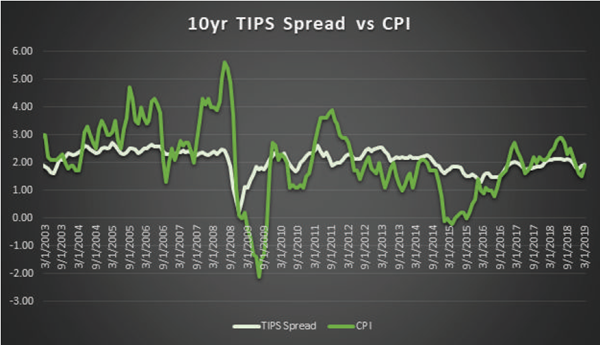
Since 2003, the 10-year TIPS spread has fallen short of being an accurate indicator of inflation. Looking at the
graph above, the TIPS spread stays relatively flat, hovering around two percent, except during the financial
crisis in 2008 and 2009. Actual CPI data is noticeably more volatile, weakening the idea that the TIPS spread is
an accurate indicator of inflation. The correlation between the two sets of monthly data confirms what the
graph above shows us. From January 2003 to March 2019, the correlation between the TIPS spread and CPI is
.3487. A correlation coefficient of .3498 represents a weak, positive correlation between the TIPS spread and
CPI. A perfect correlation, by comparison, would measure 1.0.
After looking at the data since 2003, the 10-year Treasury note vs 10-year TIPS yield spread provides little
insight of inflation to investors in the market. One interesting point to make is the average of the spread versus
the average CPI since 2003. We already know from earlier that the average yield spread is 2.08%. The average
CPI since 2003 is 2.11%. Without looking any further, an investor may think that the spread is an accurate
indicator of inflation. However, by looking at the data month by month since 2003, the investor will see that
the two don’t follow closely to each other as much as the averages suggest.
Download the PDF Version