The Money Came. Now What?
April 2022
By Kevin Chiappetta, CFA, President, QuantyPhi
Many conversations I have had with credit union finance folks have wandered to the dilemma of how to model non-maturing deposits, especially now that those deposits have grown substantially. Modeling these deposits has been a conundrum since the advent of financial modeling. The modeling exercise requires that we assign a contractual like assumption to deposits that have no contractual end-date, only a presumed end-date for the deposits to remain with the credit union. To make things more complicated, the deposits are funding assets which have very clearly defined contractual end-dates. This mismatch is commonly referred to as a financial risk.
Our first instinct is to see if we can discover some predictive element to deposits. By reviewing deposit activity, we can see that there seems to be a pattern of change in deposit totals as it relates to interest rates. While it may not be as intuitive, we do notice that deposit balances tend to grow as rates decline, and balances decline as rates increase.
In the chart below, the relationship between savings (using M1 as a proxy) and interest rates (using Fed Funds) can be seen clearly.
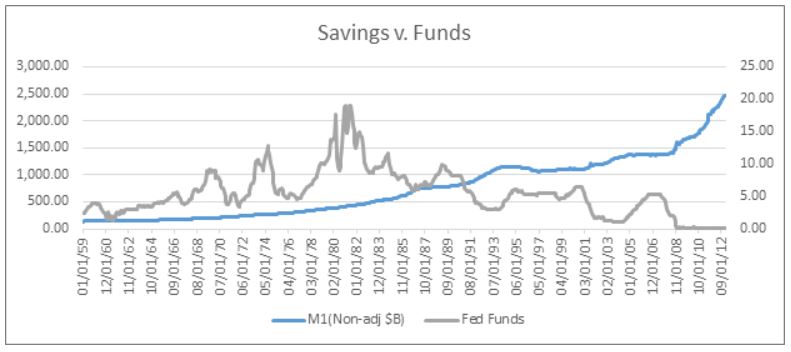
However, when we extended the data series, the relationship between savings and rates started to make interesting changes. The beginning of the break starts at the right end of the chart, and we see savings grow even as rates are stagnant. One reason for this is the Fed Funds rate nears zero, the rate can’t drop any further. In the United States, we are not prepared to see negative rates as we saw in other, mostly European countries. A second, more important reason, is the time we are focusing on was heavily influenced by the substantial intervention of money markets by the Federal Reserve.
This isn’t meant to be a discussion on Fed policy, rather, a look at how we need to reflect our model forecast because of the policy. When we approached the exercise, we were hoping to develop some predictive value on the relationship shown above. To find a stronger relationship between money supply and interest rates, we had to remove the data of the last twelve years. It didn’t take much review to realize that removing data to prove a relationship was the exact wrong process. This isn’t to say that the relationship between the funds rate and money supply doesn’t exist. What we can say is the relationship between funds rate and money supply cannot be proven. There is a difference in these two statements.
In the absence of a predictive indicator, we are left to test our funding source for sensitivity to deposit run-off. This is the only way we increase our confidence that our modeling forecast has demonstrated the reliance on member funding isn’t causing an excess risk that losing that funding can cause a negative earnings event. We must test various funding changes to see the financial impact of each shift in our member funding.
Suggested tests include:
-
Increasing costs as interest rates rise. We may be calibrating our pricing sensitivity too low. This test can tell us how sensitive our pricing can be before it becomes too costly.
-
Faster run-off of deposits. If our members are willing to pull deposits faster than we assume, we may be forced to replace deposits with other forms of more expensive funding. This test will help us see how fast run-off can get before it becomes detrimental.
Testing for these sensitivities will help credit unions understand exactly how much pressure they can manage under the most extreme cases. Our business relies on understanding these risks. Testing to get the answers is an investment in time that may well pay off with better awareness. This awareness is what we need to make better decisions in the face of pricing pressures that we simply cannot predict.